
Using Jupyter notebooks to perform qualitative analysis (or at least the data visualisation element)
I have previously shown examples of how I have used D3.js to follow on from the qualitative analysis in Obsidian to visualise the resultant output in a tree plot. In this section I show the use of Jupyter and the python squarify and wordcloud libraries to do the same and I think with a greater degree of control. All of this was made possible by the help of GPT-4 and took under an hour even with my Covid addled brain.
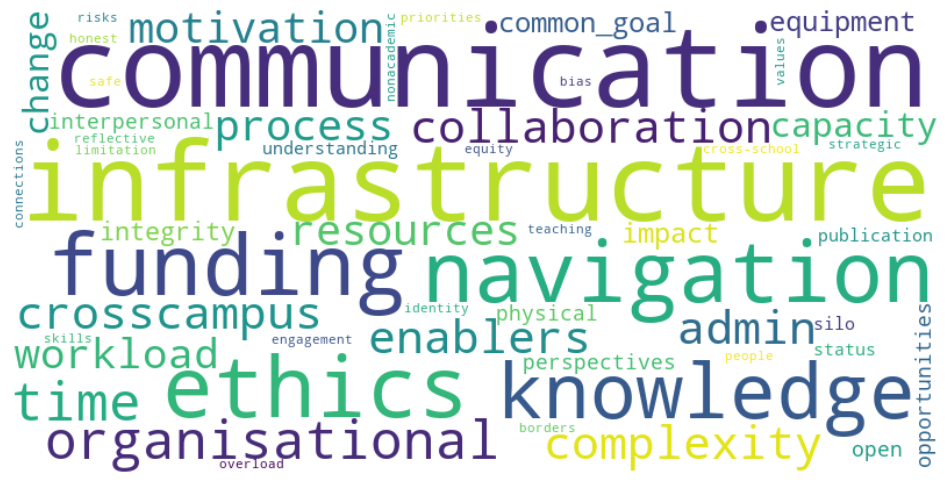
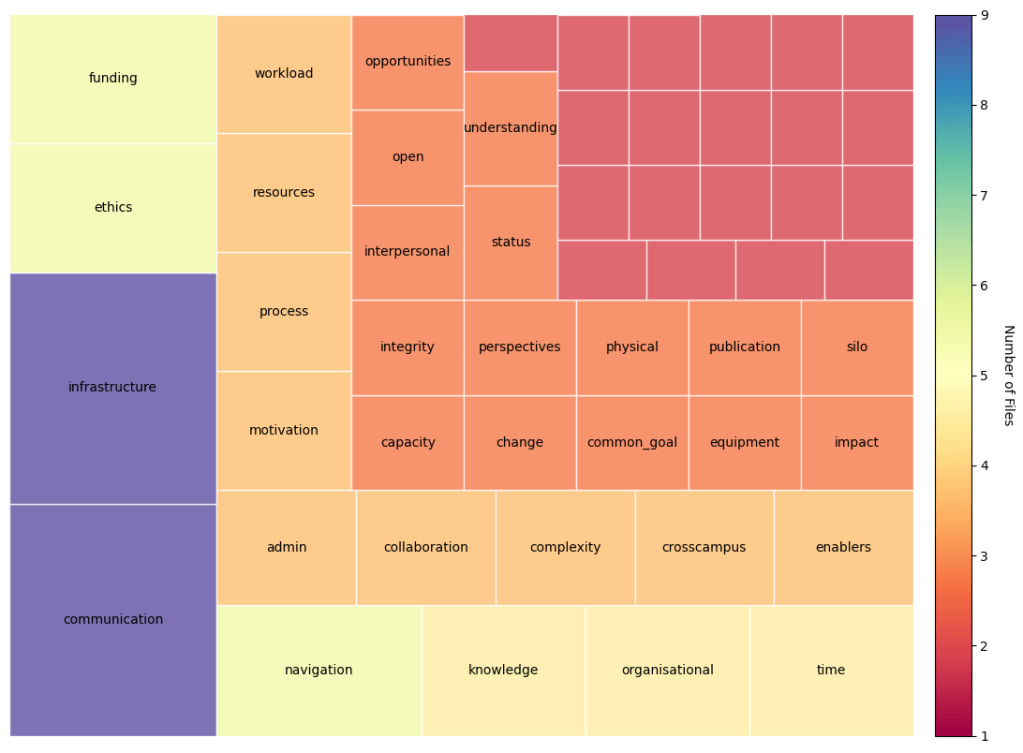
In this process I take the output of the tag counts in Obsidian from the Dataview plugin and paste them into a csv file (this can be automated with a modification of this script . With the CVS file in hand this process then uses python in a Jupyter notebook to browse for and upload the csv file and then generate the tree plot and the wordcloud. I made a modification such that the labels do not display on the squares with only one entry so as to neaten up the presentation of the data.
The script is probably a bit convoluted as I directed GPT-4 to write in in multiple steps as I figured out exactly what I wanted it to do and getting it to run in the Jupyter notebook. The benefit of the notebook is that all the formatting can be done inline and of course its a bit easier to track whats going on with the data. (See below)
All of this is soon to be overtaken I think when the code interpreter plugin for ChatGPT comes out of alpha and becomes more widely available. In fact I think its going to replace a lot of software.
Here is the link to the notebook on nbviewer
Below is the pdf of how it renders in my own notebook. WordPress docent support iframes so I cant embed it inline.

Leave a comment