Qualitative analysis in Obsidian: First pass coding
Some of my design colleagues and I facilitated a workshop focused on developing our universities approach to interdisciplinary research.
The design of the workshop (which we will report elsewhere) featured priming the participants and then engaging with a series of structured questions that the participants engaged with in groups. The groups marked up notes on a flipboard chart and organised, coded and reported on the boards themselves within the workshop.

This work looks at taking those raw sheets and coding them in Obsidian and processing them through D4.js to produce a range of tables, codebooks and visual representations useful in the qualitative analysis of this workshop activity.
The Process

- Each sheet from the groups was photographed and from the sheets each post-it note was converted into an obsidian note. This is the time consuming aspect of the process and I used voice to text dictation to accelerate some elements.
- Each note was coded using the tags feature in obsidian. Each note also carried a tag showing which question or topic gave rise to the note.
- In a number of cases an identical note appeared on multiple sheets and in these cases an additional occurrence of tag and an additional source tag was added to the note signifying its increased frequency and its occurrence across groups or across topics.
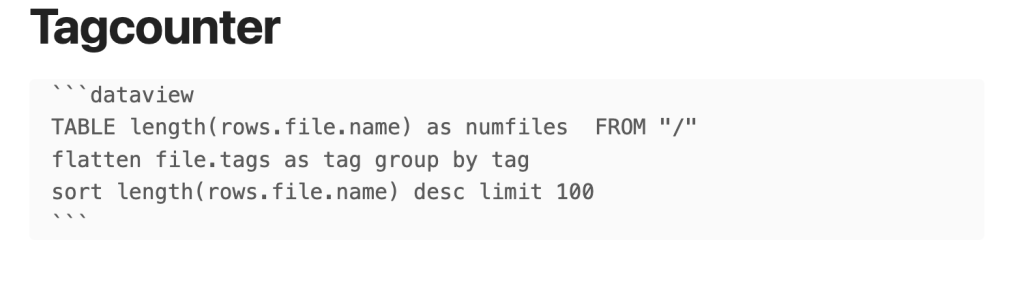
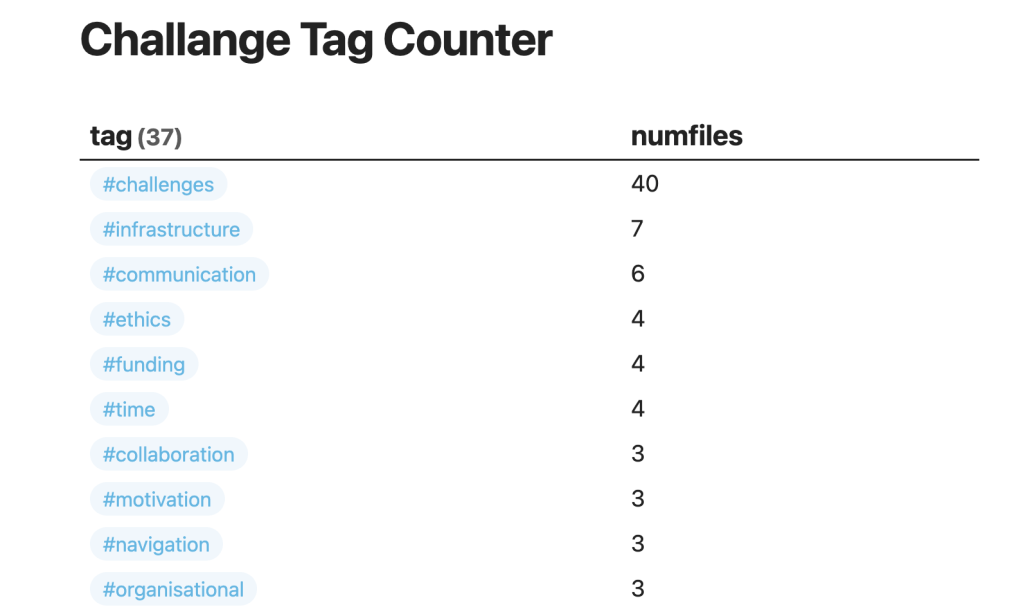
- Once each note had been created and tagged a codebook for each of the question or topic areas could be generated using the dataview plugin and the simple query shown below.
- These query results were copied out of Obsidian into Sublime (but any text editor will do) and tidied up into a csv format.
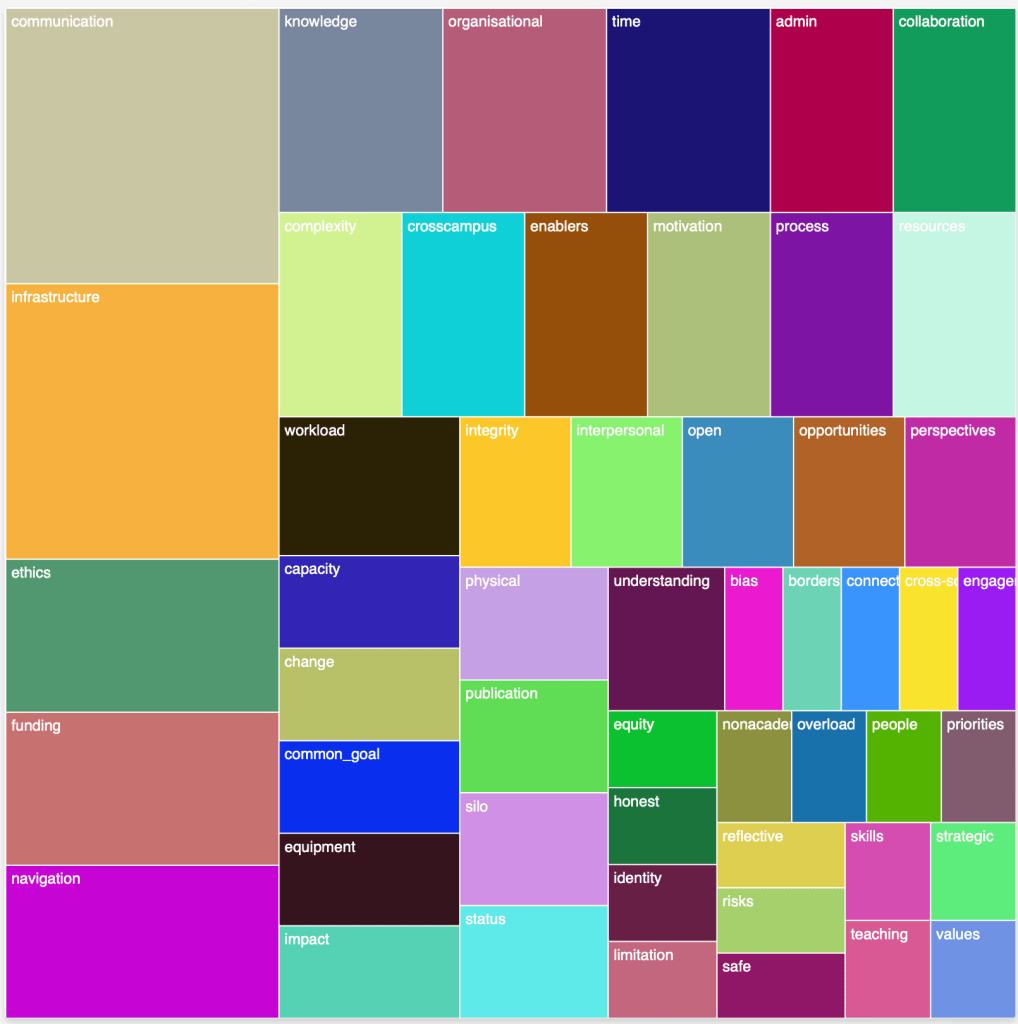
- The csv formatted data was pasted into the appropriate section of this Javascript (co-created with GPT-4) to plot the resulting treeplot . The export of the data to the plotting in treeplot chart is something I think I can automate.
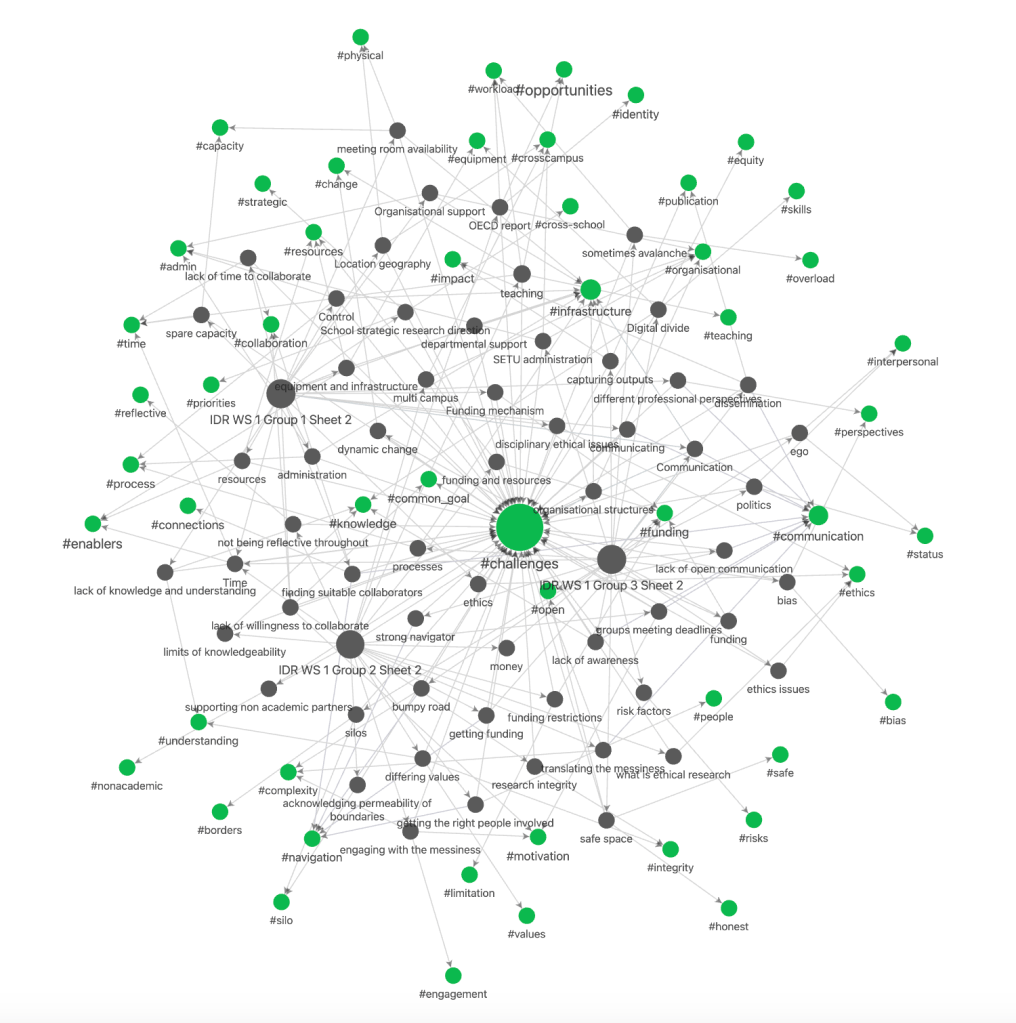
- The Obsidian graph view and dataview queries combine to give various views on the data to support the next steps of thematic coding. Here the codes are shown in green and the notes in grey. Challenges as the unifying element is obviously the strongest but we can also see the predominance of other nodes and the connections formed.
Further work and lessons learned
The eagle eyed among you will note that on the graph of the nodes there are a whole bunch of them unconnected and in the lighter grey. This is because I failed to create a note for each of these observations and have yet to code them. This however highlights a key advantage of the process insofar as the researcher can capture a thought and return to it later without creating a full note and the graphic overview makes it very easy to see which notes are as yet unfinished or lack and coding.
The next step is to work with my Research colleagues to perform a thematic analysis of the codes generated. In this step we will look at the distribution of codes, see which codes can be grouped together, and from this identify overarching themes.
As this was my first attempt at using Obsidian to do qualitative analysis my approach can be improved and refined. For instance I initially made a decision to build the notes off each of the groups as the central holding concept. This was an error I should have built the central concept as being the question. Because each of the notes is held as a simple markdown file I could restructure the analysis in this manner. I have looked at whether this restructuring could be done automatically using a query and if that was possible it would be an excellent way to re-slice the data. So as a learning point I think that the design of the analysis requires some forethought analogous to understanding what the dependent and independent variables are in a quantitative analysis. This really only impacts on the graph view of the nodes but it bears consideration for the next iteration are use of Obsidian in qualitative analysis. There is also a specific qualitative analysis workflow and plug-in which I now feel I have enough knowledge to have a look at.
As a follow-on piece I also intend to demonstrate the utility of the canvas function in visualising the execution of the workshop itself and the assets were used in the workshop process.
I must also change the plot script to but names on the treeplots the stop them getting mixed up.

Leave a comment