
Qualitative Analysis
I’ve used commercial qualitative analysis software to good effect in the past but I was unsatisfied with its lack of flexibility and critically the closed file format and the upgrade cycle. I was badly caught out trying to get Nvivo to install on Windows to open some old projects. I was attracted to Obsidian for the reason of using straightforward markdown and its excellent ability to visualise the data in a map. It also means that I will be more easily able to share the vault structure and codebooks as these are captured in a standard folder structure and markdown.
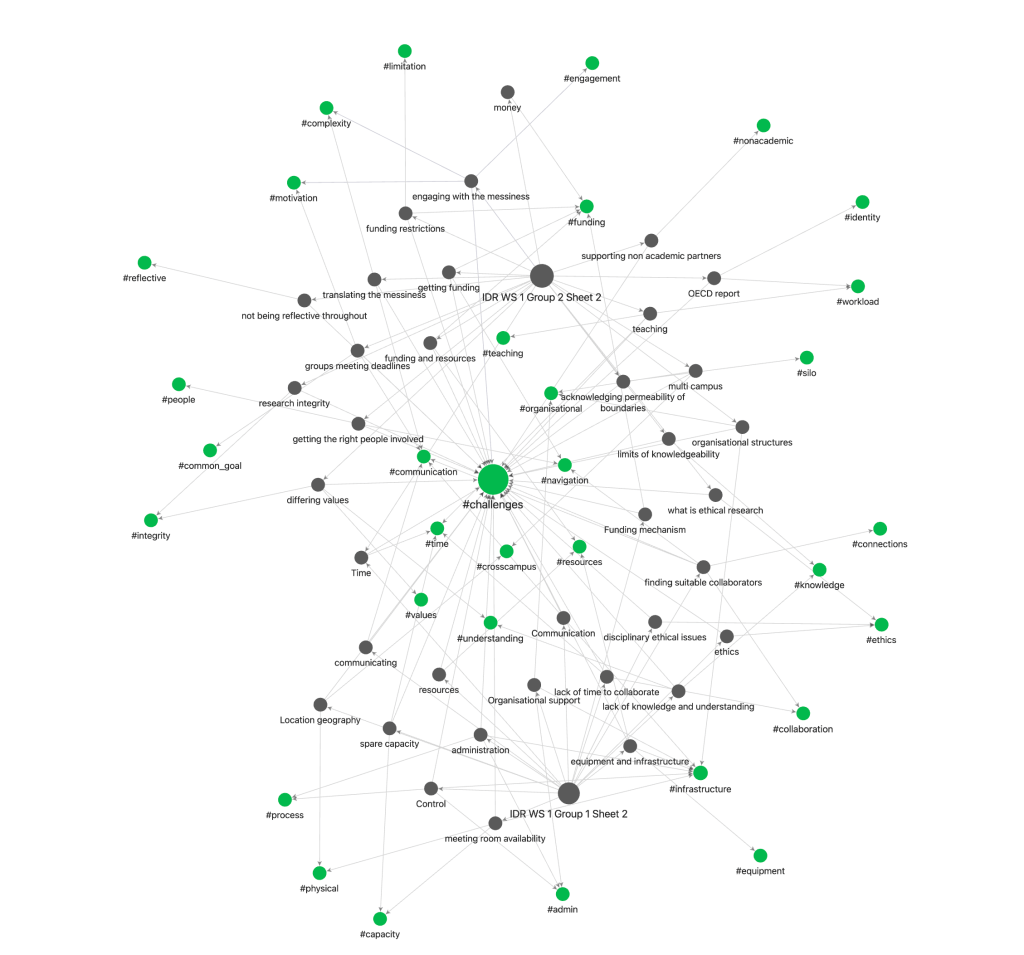
Here I am showing an example of some analysis work I am currently carrying out on a workshop we facilitated recently. I’m taking flipboard sheets with the attached Post-it note and converting them to individual notes in obsidian. In this set up each sheet get its own note and from that sheet each Post-it note also generates its own obsidian note. I am then coding each note using hashtags as a first pass coding method. Note that this vault is solely for this analysis
Utilising the inbuilt map viewer I can visualise the relationships between these notes and the codes that I have applied. This allows a visual representation of the frequency and connection of the codes.
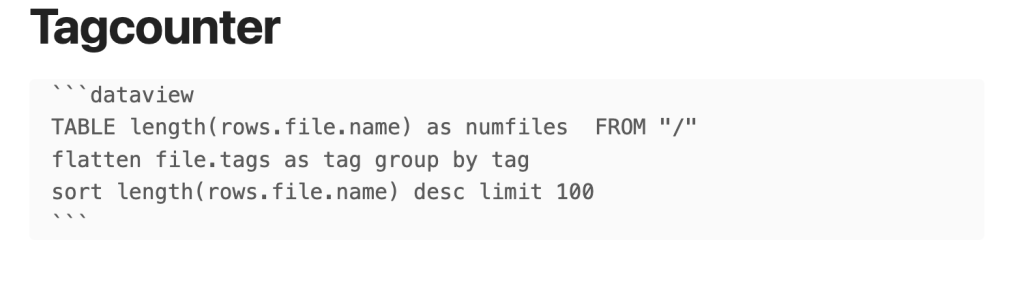
Then using the Dataview plugin I can capture and plot the data associated with the frequency of occurrence of each tag.
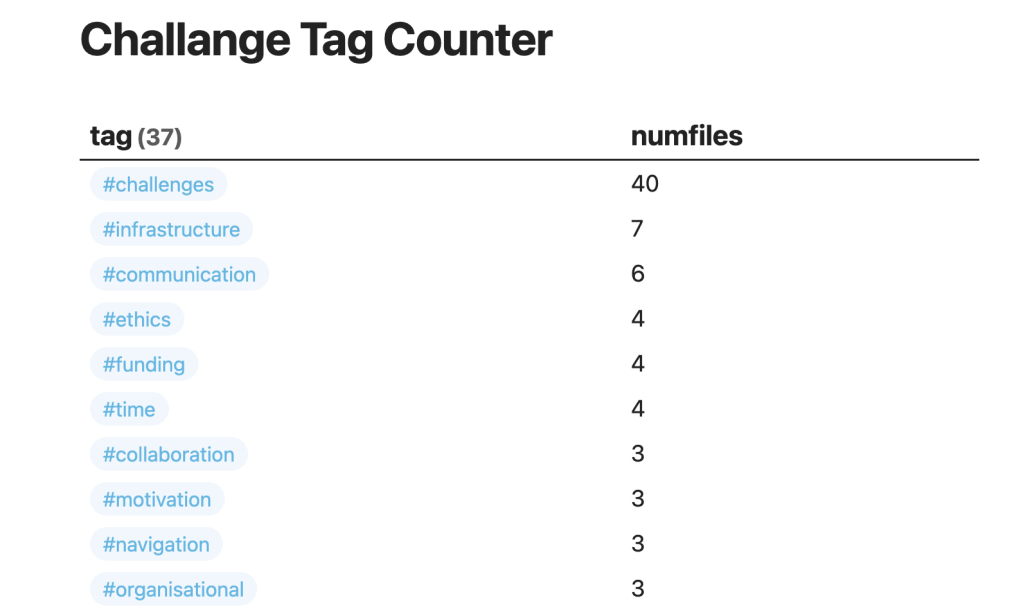
The query below looks at all the data in the vault but I can also run a simple query to show which tags co-occur in the notes.
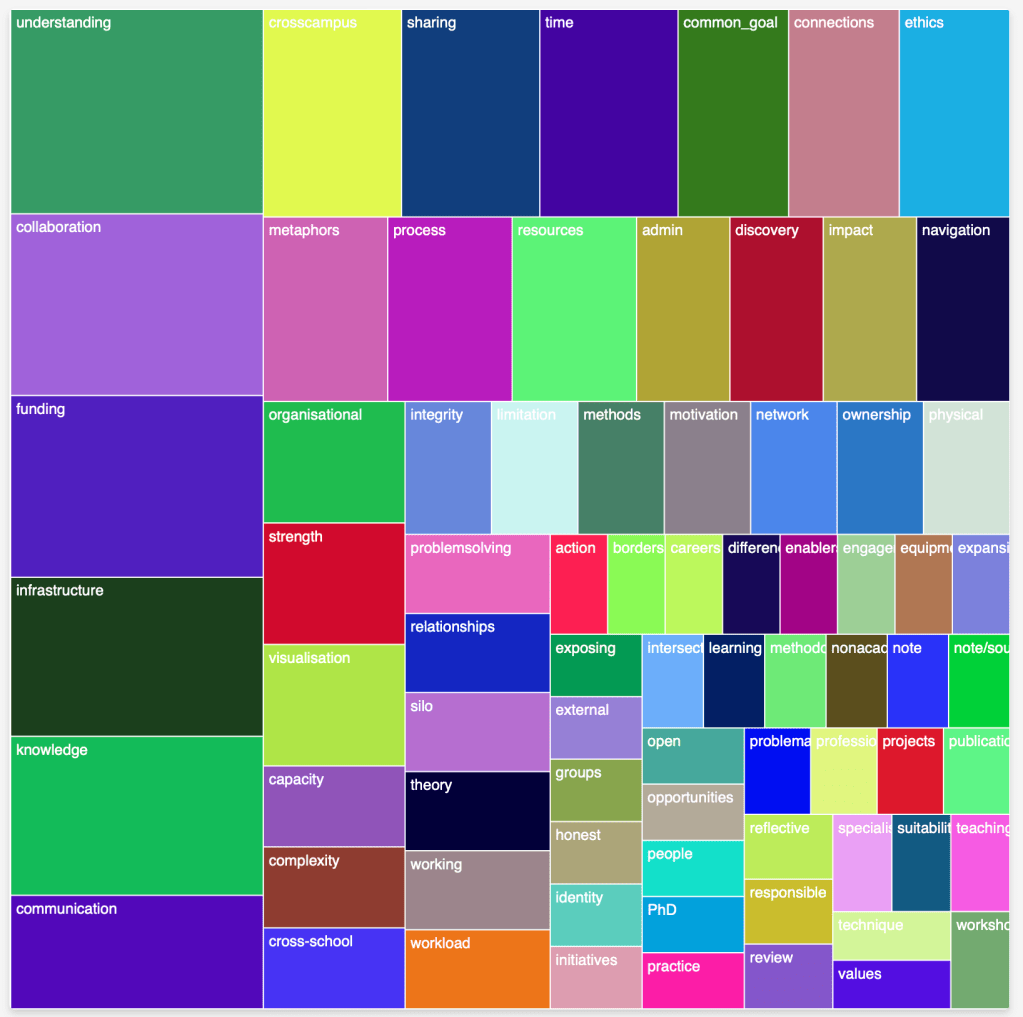
With the assistance of GPT-4 I have been able to write JavaScript using the D4.js library to plot a treemap of the resulting data. Link here to the live page of treechart with the javascript running
Promising start
Due to the presence of back linking within obsidian this system preserves the links from the generated codes right back to the original artefacts created in the workshop and show all of the associated connections at each level of the analysis. The very powerful queries built into Obsidian and added to by the Dataview plugin will allow multiple slices of the data.
Note this is just 1 slice of the of a subsection of the sheets generated and isn’t showing any real findings, divorced as it is from context. The purpose of this posting is to report on my developing workflow and I intend to do a long form article on this process when completed

Leave a comment